John A. Medeiros
![]()
Hue Discrimination and the Similarity of Violet and Purple
Before closing the current discussion, it is perhaps worthwhile exploring the power and utility of the CSM model with a specific example or two. Perhaps one of the most important things a model of human color vision should be able to do is to explain the basic hue discrimination function. Now in order to do a complete job of this in the context of the CSM model, we would need a lot of detail about quite a few things, including:
This list of necessary information is probably not even complete. But even so, absent these details, we could ask the question: is there anything useful we can do to see if the CSM model could plausibly explain the hue discrimination function?
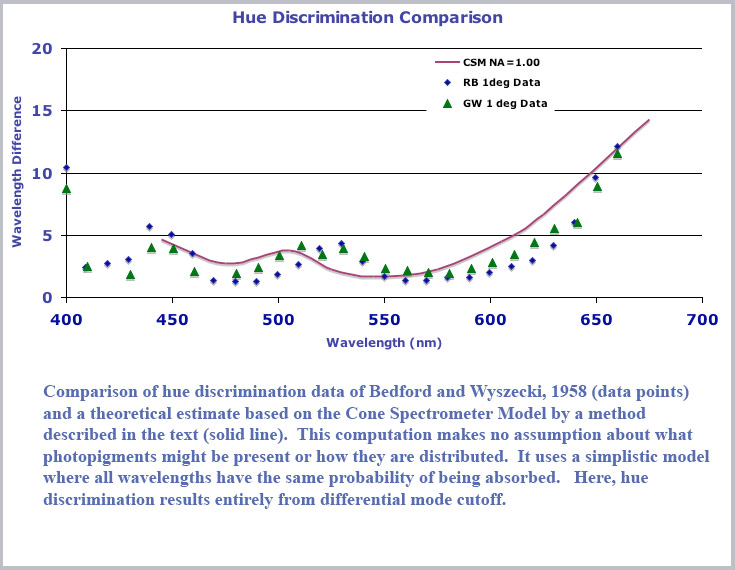
In fact , there is. Assuming nothing about any photopigments, indeed using a very simplistic model where all wavelengths are equally likely to be absorbed in a cone and using only the waveguide dispersive property of mode cutoff, we get a very plausible hue discrimination function. Using a very simple model with the cone waveguide parameter given by V= d/λ and a largest (entrance) cone diameter of 1 µm and smallest (distal) diameter of 0.6 µm, I calculated the amount of light present along the cone for pairs of input monochromatic light with wavelengths separated by 10 nm. I did this for a number of wavelength pairs in the range from 680 to 440 nm. For each pair I integrated the difference in the distribution along the cone length to get a single number that would be proportional to how different the two distributions would be. This I took as a simple measure of how well colors at a wavelength intermediate between the pairs could be discriminated (a larger value means they are more easily discriminated).
To display this in a fashion that can be compared to the usual hue discrimination curves, I took a difference of this integrated number for each wavelength pair from a constant and then (absent any direct information about how the cone signals are scaled) uniformly scaled the result (i.e., multiplied by a constant). The chart below shows the result compared with the one degree hue discrimination data of Bedford and Wyszeki (1958). As can be seen, this very simple model - with no assumptions about the cone photopigments (indeed, a very simple assumption of uniform absorption) does rather well in giving the overall hue discrimination function.

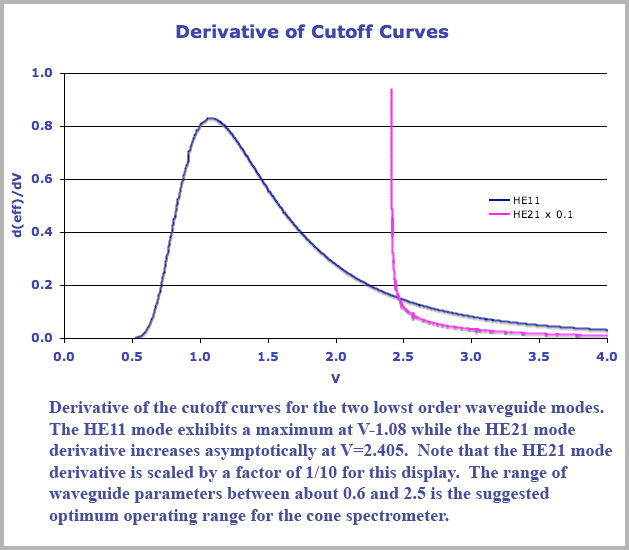
As I stated, the basis of this discrimination curve is purely due to mode cutoff in a tapered fiber for different wavelengths (no photopigment effect incorporated into the analysis). A good idea of what is happening here and how the mode cutoff curves contribute can be garnered from a perusal of the derivative of the cutoff curves. We plot below, the derivative, d(eff)/dV, of the cutoff curves shown previously for the HE11 and HE21 curves. A couple of features of this plot are worth pointing out. First, the derivative of the HE11 cutoff displays a maximum value corresponding to the inflection point in the mode cutoff curve and it represents the position of best color dispersion. If one is building a cone spectrometer based on this mode cutoff effect, it would make sense to center your operating range about this point. This maximum dispersion occurs for a waveguide parameter value of V=1.08 at which point the waveguide mode efficiency is approximately 0.24 so that about a quarter of the incident light is still within the cone interior.
Now I would suggest that there is every reason to believe that the retinal cones do exactly this and use their physical parameters (diameter and refractive index) to position the middle of its operating range at precisely this point, namely the yellow wavelength of approximately 580 nm. This would have the consequence that a specific wavelength, namely unique yellow, is tied to a physical feature of the cones so that its location should remain relatively fixed and stable. It would also correspond to the position of best color discrimination and minimal spectral purity as yellow indeed does so c orrespond (discussion of spectral purity is beyond the scope of the current document and the saturation function is derived and discussed extensively in the book, Cone Shape and Color Vision where it is compared to the standard data). Note also that centering the cone operating range about this maximum derivative point also suggests some features to look for when cone spectrometer operation is mistuned - a defect that I suggest occurs in some forms of color deficit vision (see below).
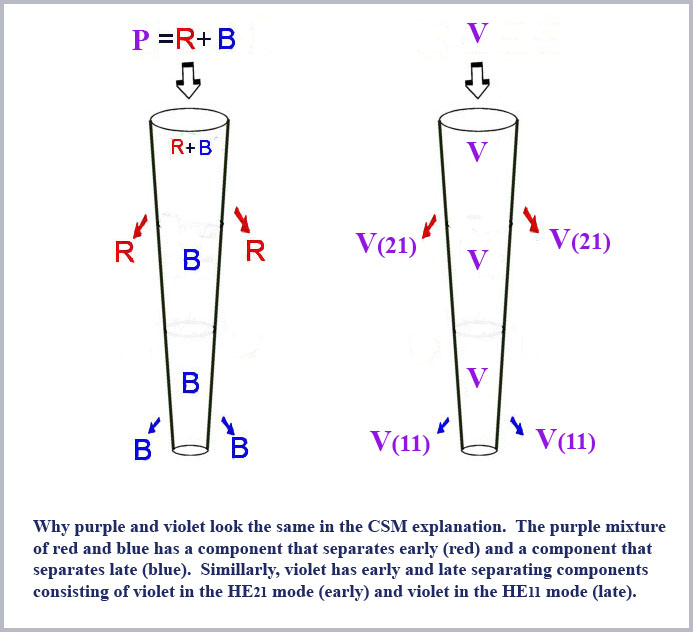
Another notable feature of the mode derivative curves is the very large values of the derivative of the HE21 curve, reflecting its abrupt cutoff. Note that this cutoff terminates abruptly at the waveguide parameter value of V=2.405. Values this large will occur for the shortest wavelengths propagating in the largest (entrance) portion of the cone. What will happen in this case is that short wavelength violet light will then propagate (at least in the wide part of the cone) in two modes, both the HE11 and the HE21. The HE21 portion will cutoff very rapidly and behave, in fact, like long wavelength red light. That is, violet will propagate in the cone like a mixture of red and blue light (the HE11portion of the violet will continue down the cone and attenuate like blue light) . A mixture of red and blue light is, of course, the color purple and this effect thus explains the long puzzling similarity of violet and purple. The separation process as it will occur in the two separate cases of either purple or violet incident on a given single cone is schematically illustrated in the cartoon figure below.
The rapid cutoff of violet light in the HE21 mode accounts for the secondary minimum in the color discrimination curve plotted above. That secondary minimum is not more abrupt in the curve simply because a smooth line is drawn between only a few values of the wavelength pairs that I computed for the plot.

Bac